Sticks and stones may break my bones, but words (and memes) can never harm me.
Growing up, this was something I remember hearing often (we had to make do with hand-drawn caricatures back then). Words intended to cause offence and evoke emotional reactions are best ignored. A lake by another name is no less beautiful. Names are just names. People have different names for different things, or we wouldn’t have thousands of languages spoken around the world.
But there are words which signal impending sticks and stones and these we do need to pay attention to. The latest escalation in the US / Canada trade conflict is unfortunate, and the words being used to signal further escalation are concerning. The latest round of tariffs is expected to impact an additional 5% of Canadian exports to the US and could slow Canadian growth by a further 0.3%. The effects will be felt hardest in manufacturing-heavy provinces like Ontario and within directly targeted sectors like autos. Average effective US tariff rates on Canadian exports now stand at ~6.3%, covering ~20% of exports to the US. The total GDP drag is estimated to be ~1-1.5% per year. The retaliatory tariffs which Canada has placed on the US will be far less consequential for the much larger US economy. Consumers on both sides will suffer at a time when the cost-of-living squeeze is already hitting households hard.
I try to be optimistic about all this for the simple reason that these tariffs don’t really make much sense.
-
If the US administration’s goal is to bring manufacturing jobs back to the US, then picking a fight with Canada won’t help much. Canada exports mostly raw, unfinished materials to the US and imports mostly finished goods from the US.
-
If the goal is to balance trade deficits, then the fact is if Canadian Energy exports are removed from the data, Canada would actually run a deficit with the US. The US is a beneficiary of cheap Canadian energy because Canada has relied too heavily on exporting to the US and has not sufficiently developed other export markets. There are signs this is now changing which would ultimately benefit Canada.
-
If the goal is to raise revenues through tariffs, then this doesn’t move the needle much for the US running a $40 trillion national debt.
We can muse about whether there may be other political goals but, in the end, growth, prosperity and dollars in voters’ pockets usually talk much louder. Let’s hope so.
The silver lining in all this is that Canada’s economy has been in the doldrums for too long and this kind of action may be just what’s needed to force change. Up until 2014, Canadian income and GDP per capita closely matched the OECD average. Since then, it has had the worst income and GDP per capita of the G7 and fell below the OECD average in 2024 for the first time ever. This underperformance can be largely attributed to poor domestic policy resulting in lack of investment and declining productivity. The current federal government seems to have some understanding of this, but it is not clear whether the appetite is really there to implement the deep structural changes required. We will be watching closely and hoping this marks a turning point.
What all of this means for markets is anyone’s guess. We cautioned about making market predictions relating to tariffs last year and we advise the same caution today. It is better to seek divination amongst other tea leaves.
One of the teacups we peered into last time is the shifting dynamic of equity supply vs. demand from corporations buying back their own stock. The supply has indeed been enormous with a record-breaking issuance total of $252 billion in Q2 alone (including a mammoth issue from Alphabet and the SpaceX IPO). The good news on the demand side is buybacks did not slow down with S&P 500 buyback volume growing about 11% year over year in Q2. Goldman is now forecasting ~$1.4 trillion of US stock repurchases in 2026 against an estimated $700 billion of primary issuance. The balance has not flipped yet, but this is worth keeping an eye on. If AI capex keeps compounding at the rate the hyperscalers are guiding to, it seems likely buybacks will slow.
Earnings and earnings growth are the tea leaves we should pay most attention to. As we highlighted last time, Q1 earnings results were nothing short of exceptional and Q2 continued that trend. US Q2 blended earnings growth was 52% from a year ago (!) with revenue up 15.5%, 87% of companies beating on EPS (against a five-year average of 78%) and 77% beating on revenue (against 70%). Importantly, net profit margin was 17%, the highest since FactSet began tracking the metric in 2009.
It is worth being clear about what that 52% is. It measures the profit dollars of all 500 companies in the S&P 500 added together, not how the average company fared, so the biggest earners dominate it. Excluding Alphabet (aka Google) alone, earnings growth falls from 52.0% to 40.6%; excluding Alphabet and Amazon, it falls to 33.8%. Two companies out of five hundred therefore account for 18 of the 52 percentage points, or roughly a third of the growth rate. A significant portion of what those two reported was not operating profit but unrealized gains on equity stakes, largely investments in private companies (e.g., Anthropic and SpaceX). These are accounting entries that can reverse as easily as they appeared. Stripping Alphabet and Amazon out would take the record 17.0% net profit margin down to 15.1%. So still exceptional, but less so.
It is also worth noting that Energy's earnings grew 146% almost entirely because WTI oil averaged $93 a barrel against $64 a year ago, so unless oil continues to rally hard, this sort of growth in the energy sector should not be expected to continue. One encouraging development sits underneath the headline: Analysts expect the other 493 companies to grow earnings 26.8% in Q4 2026 against 23.2% for the Magnificent 7. If that crossover happens, this would be good news for portfolios which have felt uncomfortably narrow for some time.
Still, with earnings and earnings growth this strong for so long, it is reasonable to ponder how long it can continue. As we have noted before, the global economy and markets have had a lot thrown at them and yet continue to perform. This indicates underlying resilience and shifts the question to what the upside might be should conditions become more benign. Some slowdown in earnings growth is inevitable at some point and there may be volatility associated with that. But there is an old market adage: “You can’t time tops.” Some might dispute that but regardless of whether it’s possible or not, if one has a long-term horizon, “tops” are usually only tops in the short to medium term. We will discuss our outlook for equities in more detail in our Asset Class Outlook.
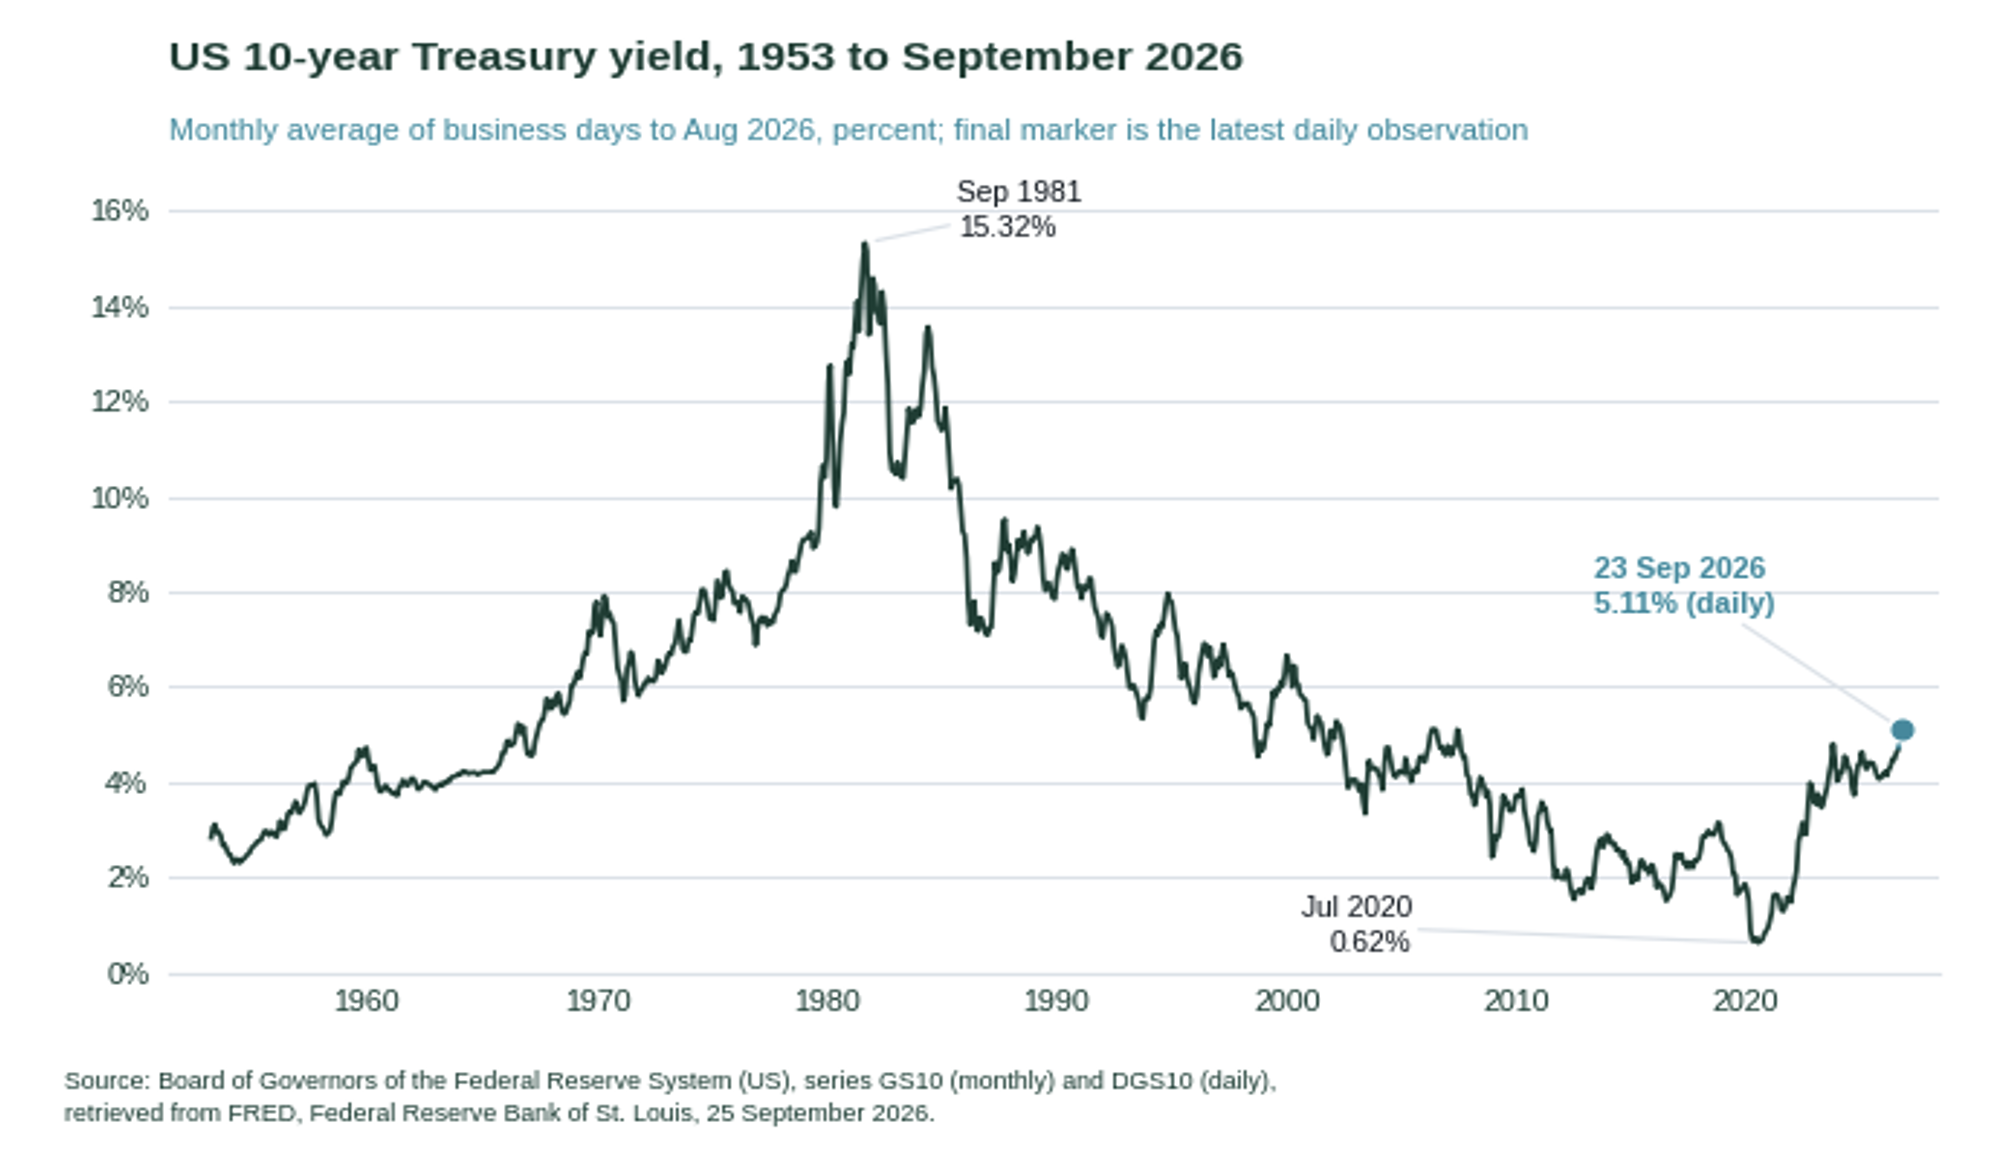
While the stock market has been in high spirits, the bond market has been a different story. If one were just to read the media coverage, it would be easy to conclude that untold horrors are being unleashed on bond investors. In fact, this is not the case and to date anyway, it feels somewhat overhyped. There is no disputing that bond yields have increased and yes, many longer duration bonds are trading at yield highs not seen for 10+ years, but the moves have been gradual, and yields are far from extraordinary in a longer-term context. Post the 2008 Global Financial Crisis all the way until 2022, interest rates and bond yields were extraordinarily low relative to the long-term history. What has happened since 2022 is that rates and bond yields have normalized to more historical levels. Meanwhile, shorter-term interest rates have barely moved, with the US Federal Reserve only recently hiking 25bps and the Bank of Canada still on hold.
This so-called “steepening” of the yield curve (where long dated yields rise and short-term yields rise much less) is related to several factors including elevated bond supply and higher inflation expectations. Context is again important. The US 5-30 Yr spread is currently ~75 bps. This is pretty much bang on the average looking back at 50 years of data. The US 30-year bond is trading at a yield of 5.4% at the time of writing while the US 10-year bond is just over 5%. This is only just above the high last seen in 2023. Some readers will remember that prior to 2000, 10-year yields above 5% were the norm (see chart below). To be clear, we are not suggesting being complacent; a rapid rise in yields from here would be concerning. But as long as these moves are contained, they should be taken in stride and seen as an adjustment back to more normal levels reflecting solid economic growth and above target inflation.
We have talked before in these pages about what could go wrong. The escalating war in the Middle East and its impact on energy prices is one of those potential risks. Hopes for a quick resolution have been dashed with the war now running over six months and increasing evidence of regional escalation. Energy markets have shown remarkable resilience given the scale of the disruption but the longer this continues, the closer we get to a tipping point. The US and Canada as net energy exporters are largely immune to supply shortages but are not immune to energy price increases which would put further pressure on inflation and likely lead central banks to respond accordingly. Economies with solid growth should be able to withstand oil prices around these levels but another sustained large move higher would be threatening.
In our Asset Class Outlook, which is available to Prime Quadrant clients, we share our thoughts on what all this means for investment portfolios.
Please click here to request the full Asset Class Outlook
Disclaimer:
Unless otherwise specified, references herein to “Prime Quadrant” are intended to mean the Prime Quadrant group of companies. The firms that comprise the Prime Quadrant group of companies include Prime Quadrant Corp. and Prime Quadrant US, LLC. Prime Quadrant Corp. is registered as a Portfolio Manager and Exempt Market Dealer in Alberta, British Columbia, Manitoba, Ontario, Quebec, and Saskatchewan and as an Investment Fund Manager in Ontario and Quebec. Prime Quadrant US, LLC is an SEC-registered investment adviser. Each firm provides specific services in a particular geographic area and is subject to the laws and professional regulations of the particular country or countries in which it operates. Each firm enters into client engagements independently. No advice is intended to be rendered, nor is any advice provided, by a Prime Quadrant company unless a client service agreement is in place.
The information in this presentation (the “Information”) does not constitute an invitation, inducement, offer or solicitation in any jurisdiction to any person or entity to acquire or dispose of, or deal in, any security, and interest in any fund, or to engage in any investment activity, nor does it constitute any form of investment, tax, legal or other advice.
This document may contain statements that constitute forward‐looking statements which are based on current expectations or projections. These statements are not guaranteeing future performance and involve several risks and uncertainties which could cause actual developments and results to differ materially from what is expressed or expected. Past or targeted performance is not indicative of future results and therefore actual results may vary.