Written by: Alex Da Costa
Forget the Moon, we’re going to Mars (apparently)
A year ago, investors were consumed with concerns about tariffs triggering a global slowdown, US bond yields exploding because of growing deficits, the end of “US exceptionalism” and a terminal decline for the US Dollar. And here we are, twelve months later, global growth for 2026 is expected to come in around 3.1% (vs 3.4% in 2025), US 10-year bond yields are still around 4.5%, the dollar has stabilized and the US economy appears to be as exceptional as it ever was (well, almost).
The other big concern a year ago was around stock market valuations, earnings growth peaking and concentration of the top 10 names. And yet, just a few weeks ago we witnessed a US public company earnings quarter which smashed the record books. Did investors sniff this one out all along thus explaining the remarkable resilience of markets in the face of a torrent of negative headlines? Bull markets are sometimes misconstrued to be easy but as any rodeo rider can attest, these fearsome beasts are determined to throw off all but the most committed long-term investors.
If the ride seems to be wild, it may get wilder still. Much has been written about the astronomically ginormous ~$86 billion SpaceX “SPCX” IPO which has smashed literally every record along with the IPO listing and index inclusion rule books. The listing has been carefully structured to support the price by offering only a small fraction of the shares in the IPO (~4%) and then a rolling lockup expiry of the remaining 96% over 12 months (culminating with Elon Musk’s ~50% stake). Thus, it may take some time until the free float expands enough for there to be real price discovery. It is worth keeping in mind that the private investors in SPCX have mostly bought in at substantially lower valuations so many will have an incentive to sell and lock in huge gains. On the valuation side, we highlight just one metric: at the IPO price of $135, SPCX was valued at over 94x trailing 12-month sales. This absolutely dwarfs almost every previous large IPO valuation (Chart 1) and that of every single mega cap stock trading today (Chart 2). NVIDIA is the next closest at 20x trailing 12-month sales, but with massively higher growth rates and profits. The important thing investors need to remember is it is impossible to say how long the SPCX valuation can stay disconnected from any normal metrics. But if there comes a point where investors feel the dreams are failing to live up to reality, this rocket ship may fall back to Earth in spectacular fashion. Still, if anyone can pull this off, it’s Mr. Musk, now the world’s first trillionaire (on paper anyway). After all, his other company, Tesla, has defied the laws of fundamental valuation for most of its time as a listed public company (though at a significantly lower premium to SPCX’s current valuation).
Chart 1 — SpaceX vs. landmark tech IPOs (1997–2026)
Price-to-sales ratio at IPO offer price, using trailing twelve-month revenue at time of listing.
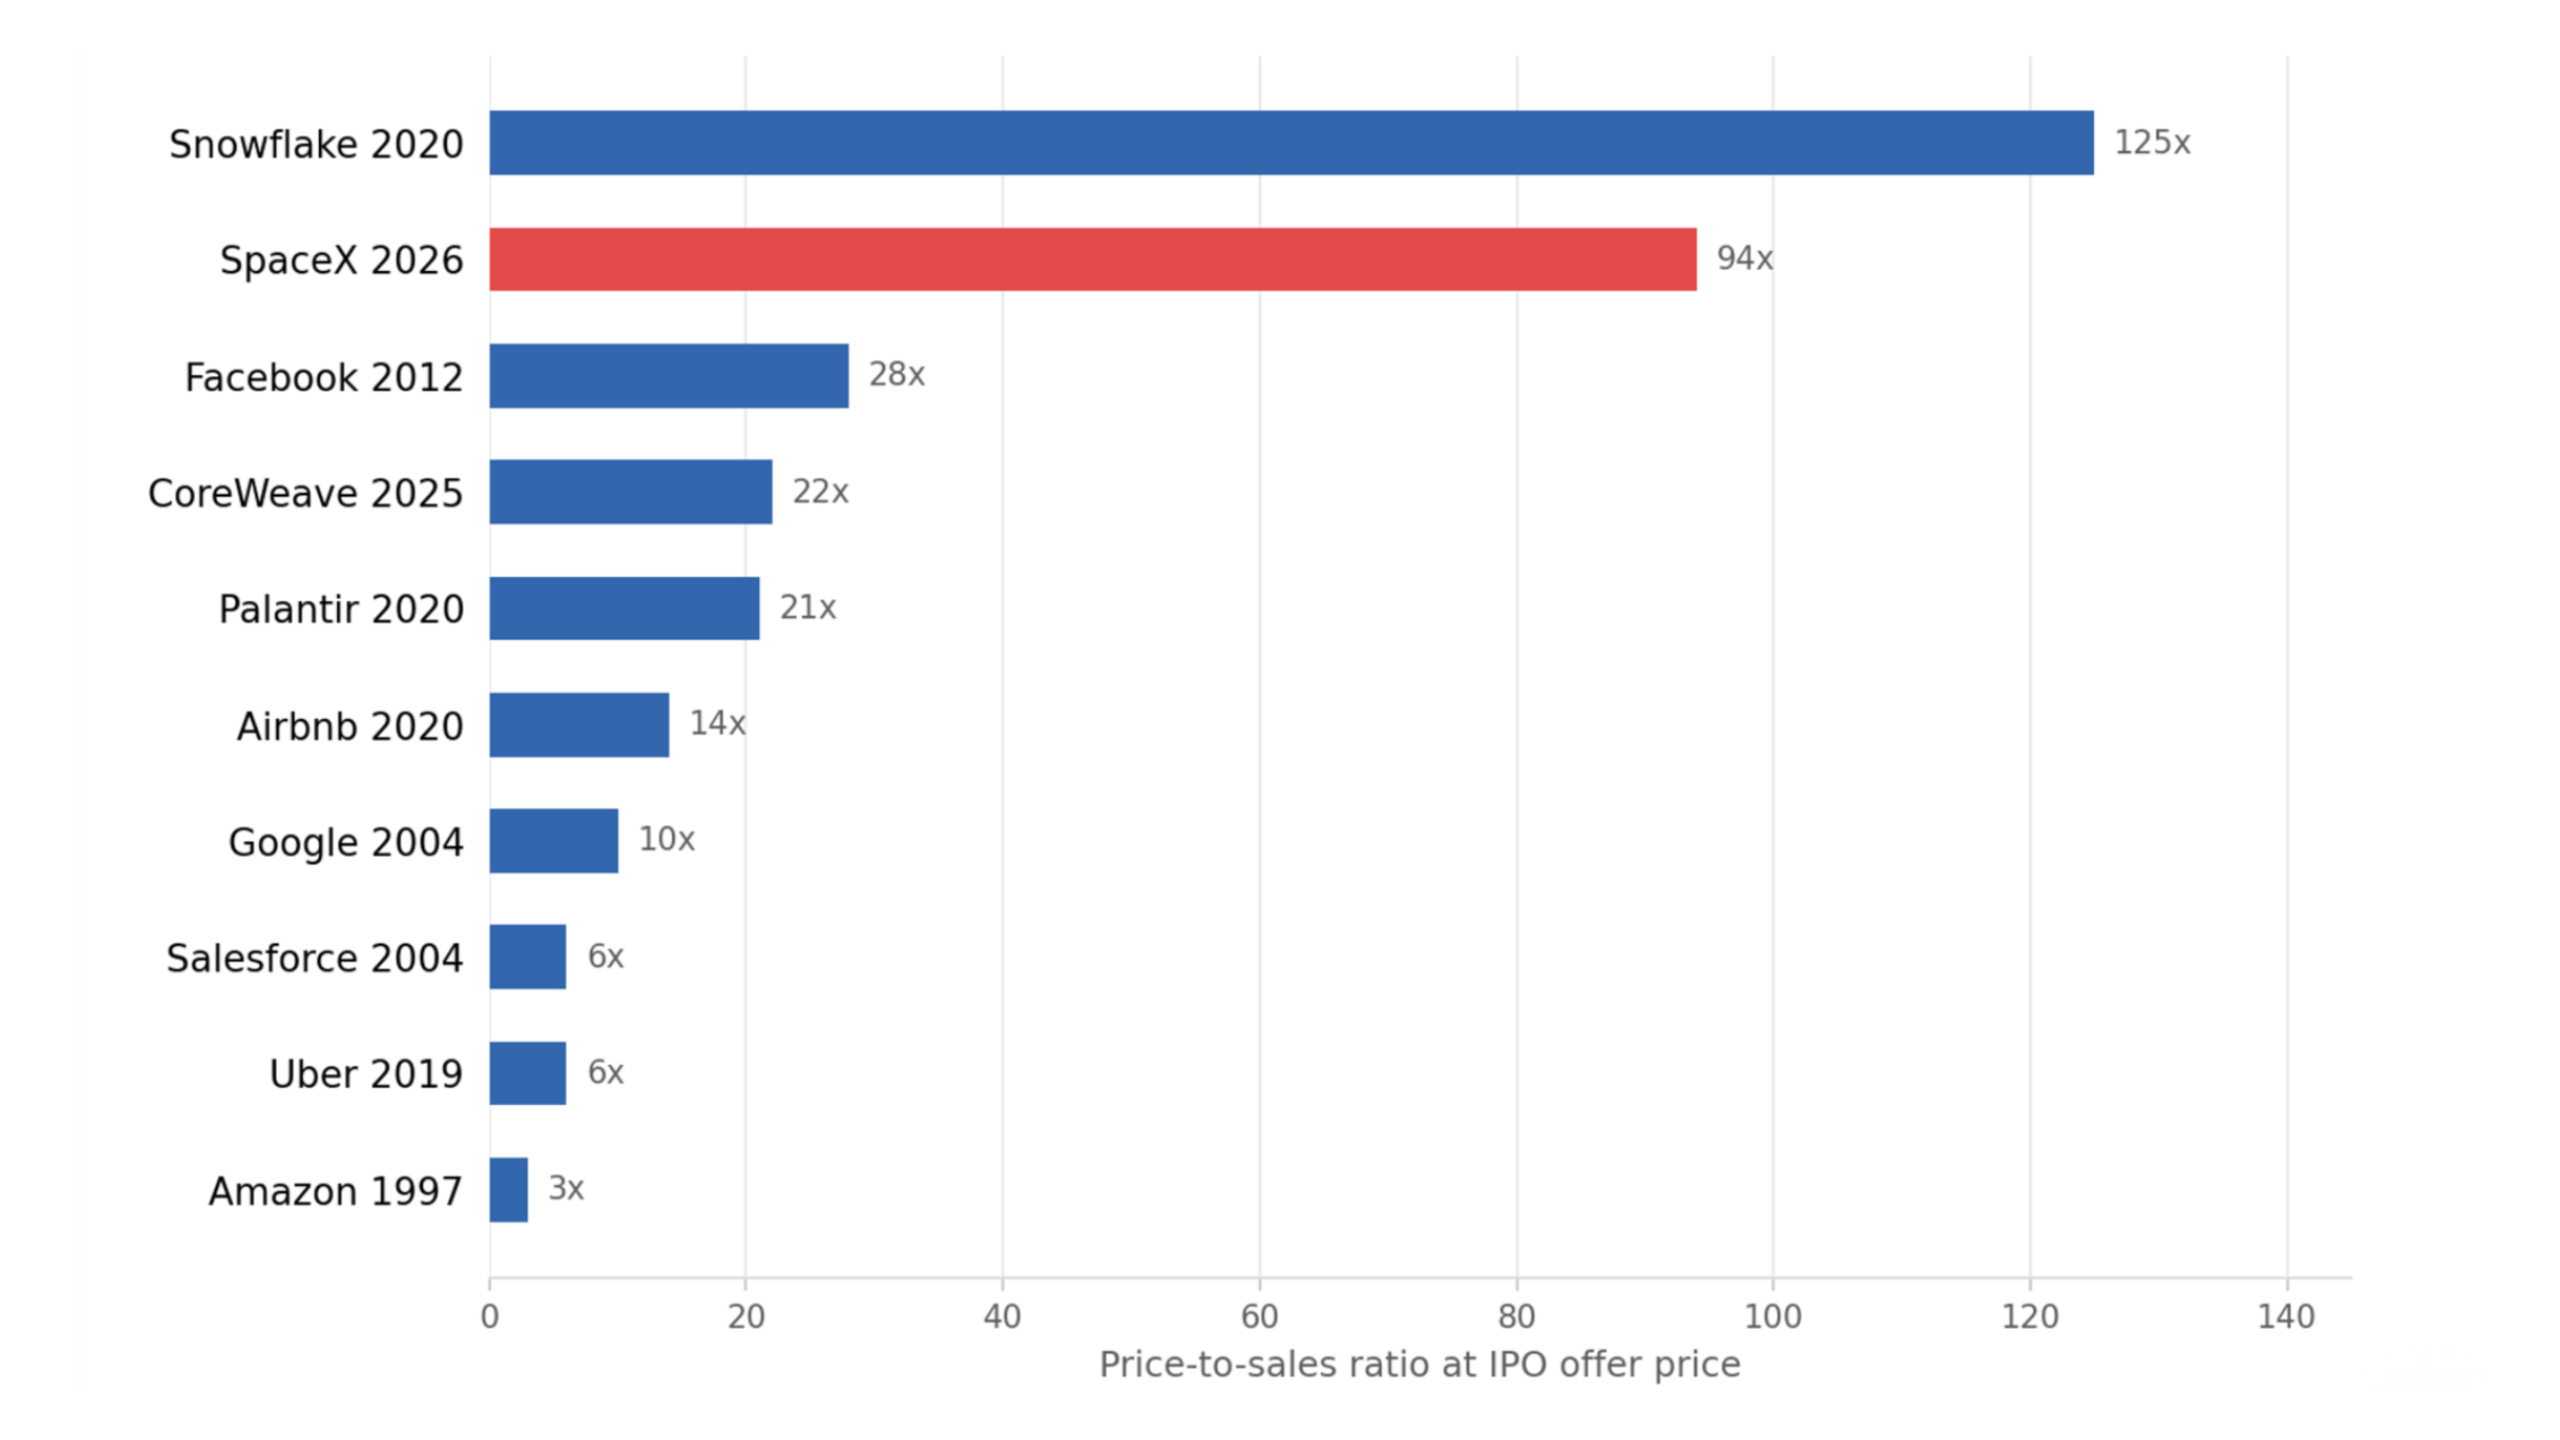
Note: Snowflake FY2020 TTM revenue $265M; IPO valuation ~$33B (125x). Facebook 2011 revenue $3.7B; IPO valuation $104B (28x). Google TTM revenue ~$2.3B; valuation $23B (~10x). Airbnb 2020 revenue ~$3.4B; IPO valuation ~$47B (14x). SpaceX 2025 revenue $18.7B; IPO valuation $1.75T (94x). Sources: SEC filings, Bloomberg, CNBC.
Chart 2 — SpaceX vs. S&P 500 top 10 by market cap (June 2026)
Trailing twelve-month price-to-sales ratio.
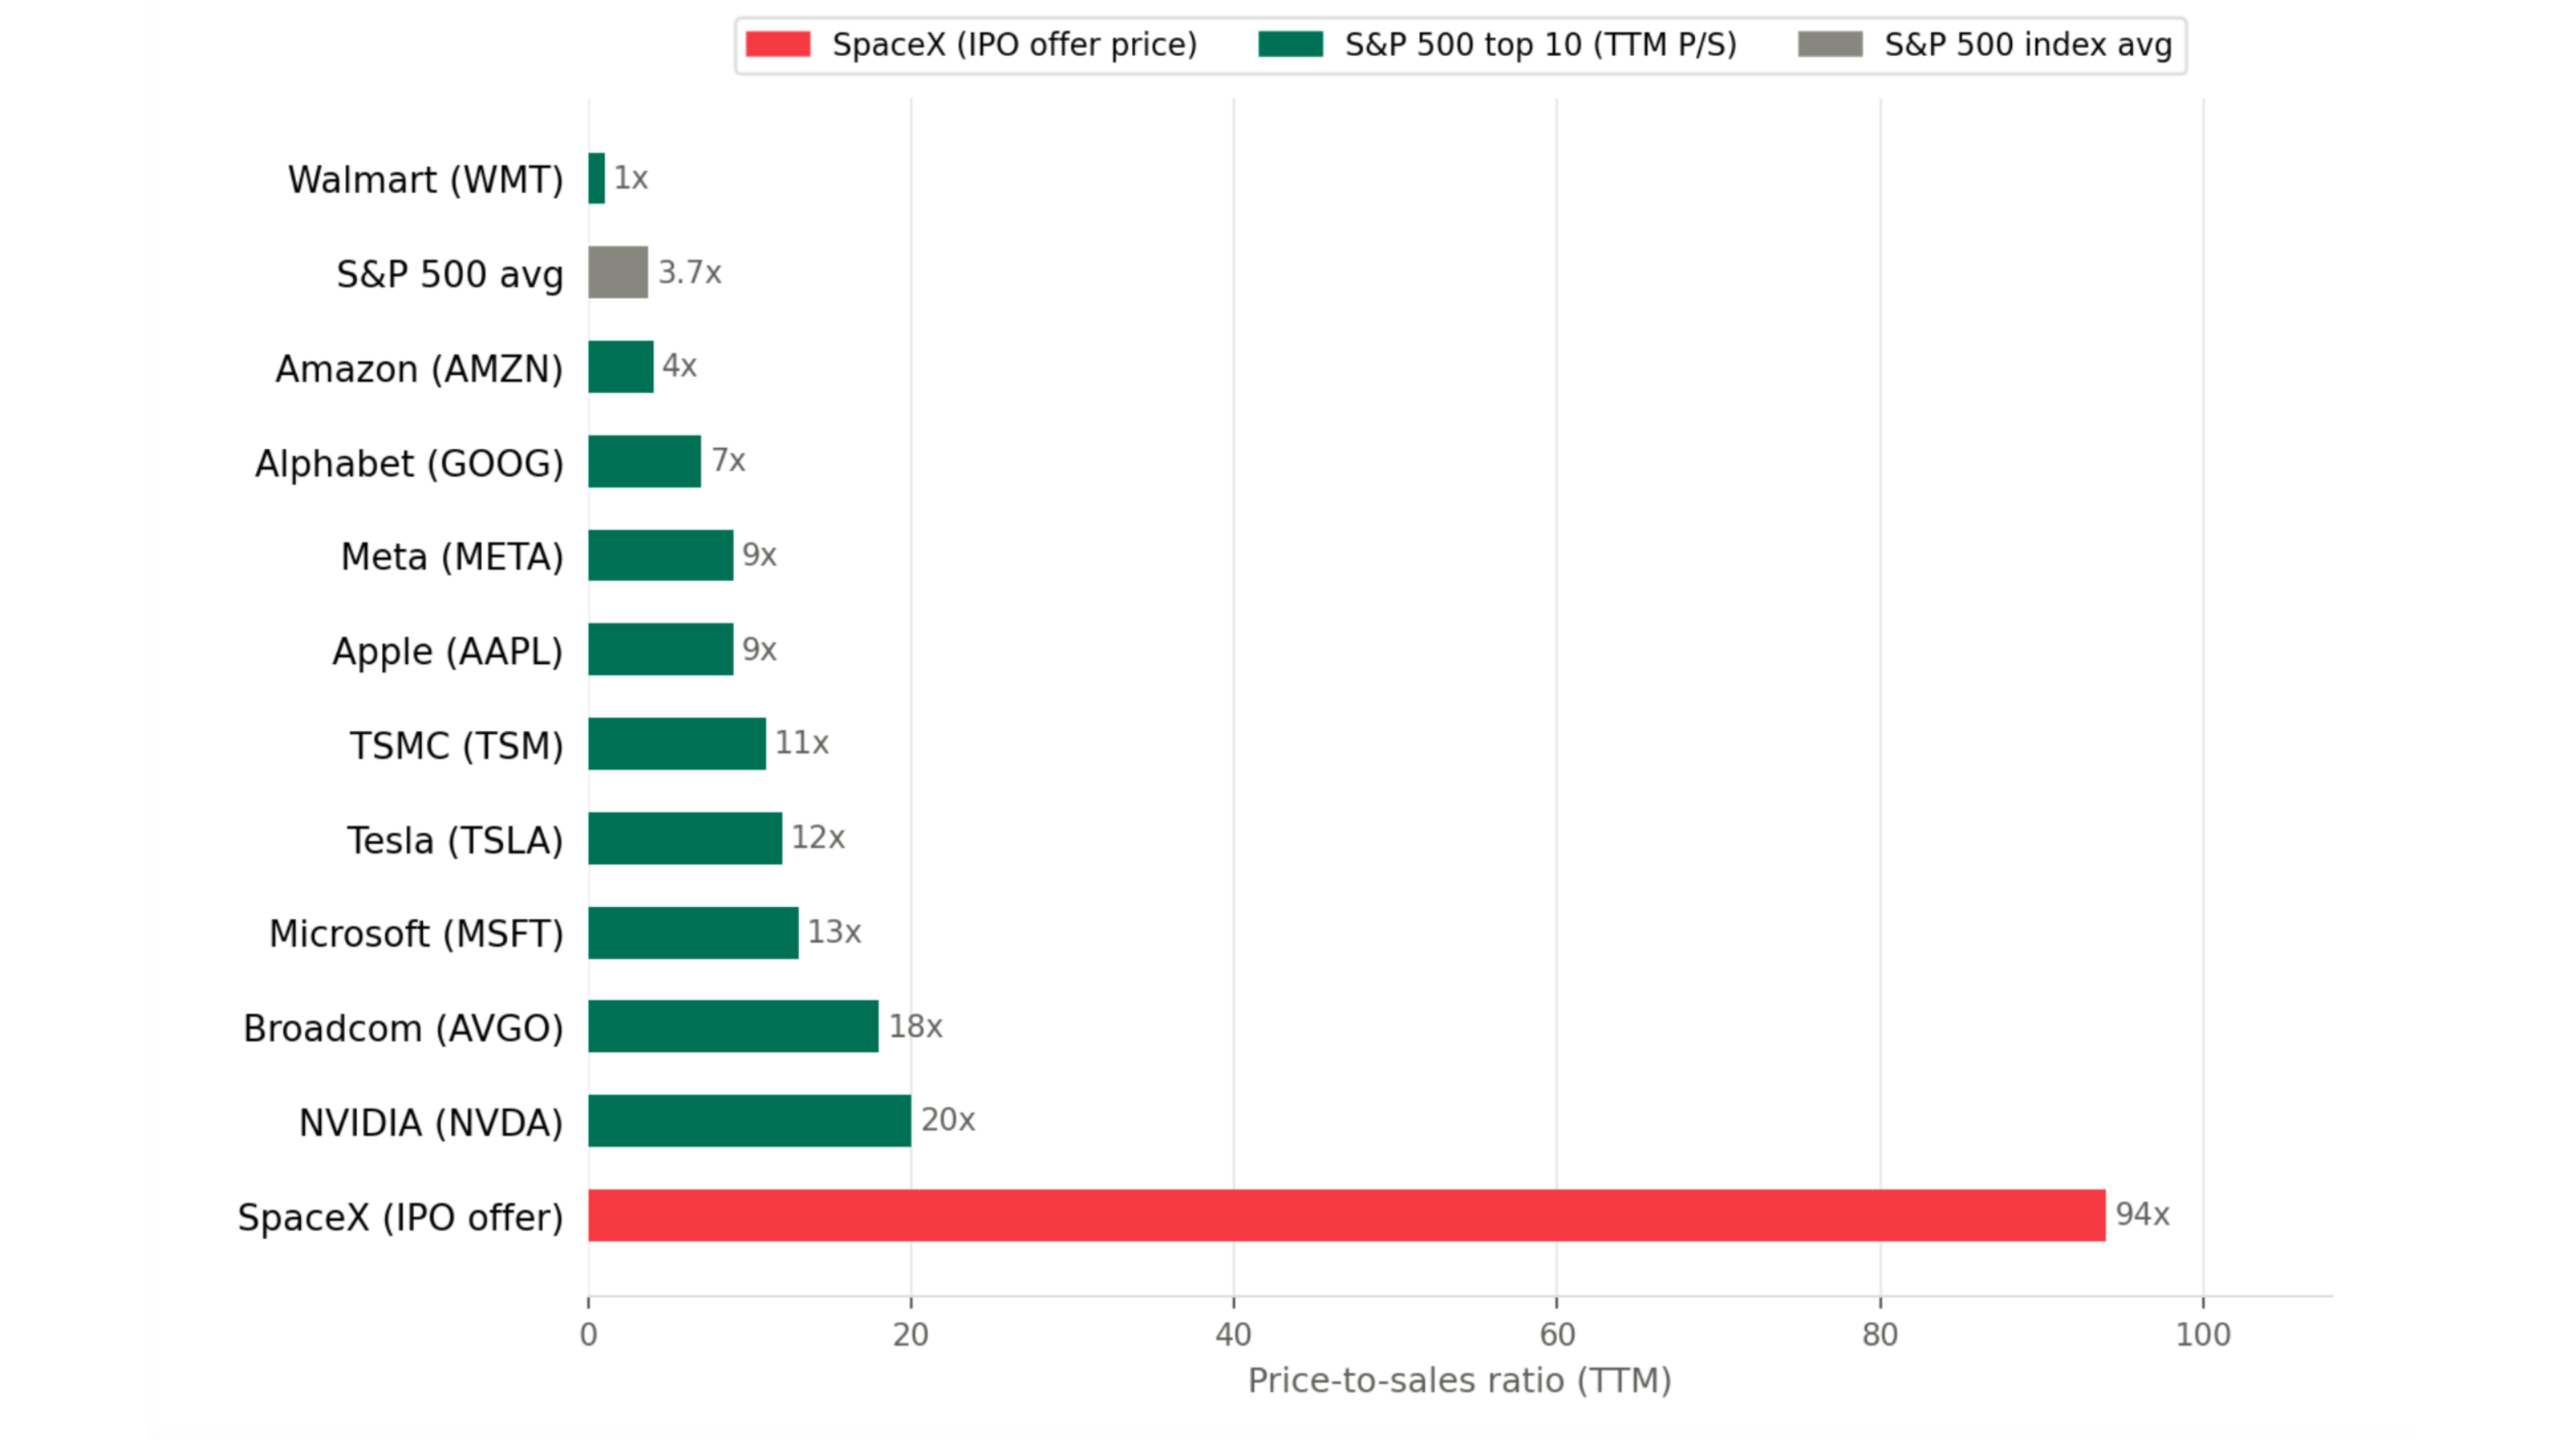
Note: Berkshire Hathaway excluded (financial conglomerate); replaced by Walmart (#11). NVIDIA TTM P/S ~20x (TTM revenue $253B; market cap ~$5.15T). All other ratios based on latest reported TTM revenue and current market caps. Sources: StockAnalysis, Macrotrends, company filings.
While the SPCX IPO makes for high intrigue, arguably the real story is it marks the beginning of a significant shift in the dynamics of the US equity market. For over twenty years, the supply of equity has been shrinking through a combination of massive share buybacks and private equity take-outs. Less supply and an increasing flow of capital into equities have undoubtedly been supportive to prices during the good times we have enjoyed in the past. We now have a series of massive IPOs in the pipe and several leading mega cap tech companies halting buybacks and doing large secondary equity raises. These large participants in Wall Street’s favourite game, “Buy the Dip”, may now start playing a different game, “Sell the Rally”. Estimates vary but all told in the region of $1 trillion of supply may be about to hit the market. Now we’re not saying that this marks the end. The bull doesn’t throw us off that easily. The market will ultimately find a way to absorb this supply. But it is conceivable that markets experience a period of higher volatility until all this supply is digested.
Back to earnings, which is by far and away the dominant factor driving stock prices. The Q1 reporting cycle for US mega-cap corporations, specifically the core market-leading technology and digital services companies, delivered a high rate of positive surprises relative to baseline expectations. Heading into the reporting, consensus expectations were for S&P 500 year-over-year earnings growth of approximately 12.6%. The final blended results vastly outpaced those estimates, pushing aggregate earnings growth to 27.8%, more than double the initial estimates.
This was heavily concentrated within the mega-cap tech and communication services sectors, which recorded actual year-over-year earnings expansions of 51.9% and 55.1%, respectively. In terms of beating expectations, which is what really moves prices, 84% of S&P 500 companies exceeded consensus earnings-per-share (EPS) estimates, while 81% cleared revenue forecasts considerably above long-term historical averages. The obvious question is, can this kind of outperformance be repeated? Maybe not to these levels but it’s clear that we have been in a booming cycle with this representing the sixth consecutive quarter of double-digit year-over-year earnings growth. This kind of strength indicates underlying economic momentum which can continue until something comes along to derail it.
There are plenty of candidates for derailment with any hint of AI disappointment being at the top of that list. As highlighted here before, a vast quantum of capital is being staked on AI being the most revolutionary technology of human history. Globally, an estimated $1.6 trillion has already gone into the AI infrastructure build-out with total expected investment in the region of $5 trillion. To put the scale of this investment into context, AI capex in the USA as a percentage of GDP is running around 2.2%-3%, higher than the 1.2%-2.0% for the late 1990s dot-com boom, but well below the 5.0-6.0% of the 1880s Railroad Age. Whether such historical comparisons have much value is debatable (markets and the economy are after all very different in both eras) but these are unquestionably big numbers and the medium-term outlook is clearly increasingly tied to the success or failure of these AI investments.
Anecdotal evidence suggests that while it is certainly not early in the cycle, it is likely not late either. AI adoption at the corporate level is only now really gathering pace and there are already indications that this technology has the potential to significantly boost growth and productivity. That does not mean buying any AI-related security at any price is a guarantee of success. And as we noted earlier, we may be entering a period of higher stock price volatility so appropriate sizing will be key. But it does mean investors should maintain a degree of optimism. Big things don’t come around very often and this one is big. Maybe the biggest most of us will ever see.
A few comments on interest rates: in our last letter we noted that the outlook for central bank policy was a lot less clear than it had been, but that we did not expect rate moves to be large in either direction. Since then, an energy-driven uptick in inflation and solid US employment conditions have tilted the markets and the US Federal Reserve to a hawkish bias with expectations of 25bps to 50bps of interest rate increases by year end. Not so long ago, markets were pricing one 25 bps cut by year end. In Canada, the market continues to expect one 25bps hike by year end. The oil price has fallen significantly over the last few weeks (down more than 30% from the March highs) as traders anticipate a full re-opening of the now infamous Strait of Hormuz. Should this indeed materialize, inflation would likely ease which in turn might soften policy makers’ bias. Bond markets would seem to agree, with yields continuing to trade within a range which has held for the past 3 years (roughly 3.7%-4.9% for the US 10-year bond yield). Moreover, US five-year inflation linked bonds are pricing forward inflation of ~ 2.3% (after briefly spiking to ~3% in March this year).
The appointment of the credible Kevin Warsh as chairman of the Federal Reserve likely plays a part in bond yields and inflation expectations remaining contained. It is notable that the US dollar bottomed and began to rally almost exactly around the date of his nomination. Similarly, gold topped and began a large decline (~25%) at the same time. This appears to be investors breathing a collective sigh of relief over the potential politicisation of this historically independent institution. Still, while interest rate and currency markets are not flashing warning signals now, any further medium-term inflationary pressure warrants close attention, as this could ultimately prove challenging for risk assets.
Wishing you and your loved ones a wonderful summer!
In our Asset Class Outlook, which is available to Prime Quadrant clients, we share our thoughts on the investment landscape.
Please click here to request the full Asset Class Outlook
Disclaimer:
Unless otherwise specified, references herein to “Prime Quadrant” are intended to mean the Prime Quadrant group of companies. The firms that comprise the Prime Quadrant group of companies include Prime Quadrant Corp. and Prime Quadrant US, LLC. Prime Quadrant Corp. is registered as a Portfolio Manager and Exempt Market Dealer in Alberta, British Columbia, Manitoba, Ontario, Quebec, and Saskatchewan and as an Investment Fund Manager in Ontario and Quebec. Prime Quadrant US, LLC is an SEC-registered investment adviser. Each firm provides specific services in a particular geographic area and is subject to the laws and professional regulations of the particular country or countries in which it operates. Each firm enters into client engagements independently. No advice is intended to be rendered, nor is any advice provided, by a Prime Quadrant company unless a client service agreement is in place.
The information in this presentation (the “Information”) does not constitute an invitation, inducement, offer or solicitation in any jurisdiction to any person or entity to acquire or dispose of, or deal in, any security, and interest in any fund, or to engage in any investment activity, nor does it constitute any form of investment, tax, legal or other advice.
This document may contain statements that constitute forward‐looking statements which are based on current expectations or projections. These statements are not guaranteeing future performance and involve several risks and uncertainties which could cause actual developments and results to differ materially from what is expressed or expected. Past or targeted performance is not indicative of future results and therefore actual results may vary.